Archive for the ‘ Affirma Consulting ’ Category

HTML5/Javascript as Assembly Language

This is the continuation of this post on the future of Microsoft development.

Scott Hanselman had an interesting post about how HTML5 and Javascript are assembly language for the web.  I won’t repeat his post (you should read it yourself), but basically it’s Turing Complete so you can write any program in it, it will be runnable by any browser soon, and we don’t necessarily need to read it.  There are already options to program in higher-level languages and compile to Javascript.

Okay, so in my last post I commented on the whole Microsoft-HTML5-Silverlight debate.  Here’s my subversive idea:

We’re already seeing systems where the build target is variable.  For example, Microsoft’s recent release of Visual Studio Lightswitch can build your business apps for the desktop or the web.  And they’ve stated there’s no reason it couldn’t compile to HTML5.

Microsoft should implement the CLR in Javascript.  Let me repeat that.  Microsoft should implement the CLR in Javascript.  And the Silverlight framework.

Imagine if you had a choice of deployments!  If speed is an absolute necessity, run your application in the Silverlight plugin.  If portability is the desire, just reference a javascript file that implements the Silverlight framework.

Think about it:

  • XAML is much more productive than HTML.  C# is much more productive than Javascript.  You could use the right tools to build your site or app, and the right tools to deploy your site or app.
  • Universal Silverlight.  It would run on an iPad, or an Android phone, or any future device that implements HTML5. (Which will be all of them.)  No need to make deals with the other platforms.  Silverlight would be able to run anywhere.
  • No more need for the plugin.  Some corporate environments don’t allow it.  Some folks at home don’t want to install it.  But it wouldn’t be necessary anymore.
Microsoft has always focused on developers and made tools for professionals.  This would be an amazing way to make professional development possible in any environment.  Can it be done?  It would certainly be a task to reimplement the CLR.  But the Mono team has done it.  It’s not impossible.  And it would make a huge number of Microsoft .NET-based systems (even existing ones) instantly web-enabled and portable across all mobile devices.  Microsoft:  Go for it!  C# is for coding.  Javascript is for execution.  Shake the world up.

HTML5 and Silverlight (It’s been a long summer)

Ever since Microsoft unveiled an early build of Windows 8 in a video back in June, there has been rampant speculation on what the emphasis on HTML5 and Javascript means for the future of software development in the Microsoft world.  Specifically, what happens to Silverlight?  What happens to .NET?

There has been commentary from just about every corner:  from toolset makers such as Telerik, to ex-Microsofties, such as Scott Barnes.

And of course Microsoft has been pretty silent on all this.  The BUILD conference is coming up in about 2 weeks, but we’ve been waiting all summer, and it’s quite fun to practice Kremlinology anyway, right?

There seem to be several main theories on Microsoft’s plans:

  • .NET and Silverlight are going to wither on the vine.  The future is HTML5, Javascript, and C/C++.  The Windows division has taken over and they never appreciated .NET.
  • .NET and Silverlight will continue to exist, but they are going to be lesser stars in the MS galaxy.
  • .NET and XAML are at the heart of Windows 8 and something called Project Jupiter.  They’ll get to play on an even field with C++ at last.
Since the evidence is so scarce, we should focus on what Microsoft has actually said.
  • The future of the web is HTML5
  • SharePoint is big, and it’s going to the cloud with Office 365
  • Office 15 is on the way and SharePoint is the nerve center of Office
Okay, no point in belaboring it.  HTML5 is going to be a big focus.  SharePoint is a HUGE business for Microsoft, and it’s founded on .NET.  Throw in Dynamics and a bunch of other MS products.  .NET is not going away.
I’m excited to see what Microsoft unveils at the BUILD keynote on the 13th.
Next post:  What I HOPE Microsoft is thinking about.

SharePoint Designs – Keep it simple, but don’t go cheap

Let’s face it – OOB SharePoint has very ugly UI.  It is plain, boring and colorless.  I am by no means a design person (quite frankly, if it weren’t for my house having it’s own ‘out of box’ design too it, it would be relatively plain and boring itself).  I am one of those many people that can only tell you what I like/don’t like once it is in place.  Thankfully we have designers that thrive off of making sites (and houses) colorful, attractive and appealing to the naked eye.  The one problem, however, is that both clients and designers alike can get a little too excited about design without thinking about maintenence once the design is in place.  Perfect case in point – putting rounded corners on web parts.  I am not sure what started the trend – it is definitely prettier – but this is probably the most  common request I get across the board.  This looks great when first built, but the problem is it isn’t extensible.  As soon as you want to add content to these boxes,therefore  expanding the part, it breaks the site build.  While not impossible to do (knowing HTML/CSS this can be managed), the typical end user finds this impossible to manage and you lose an important part of what SharePoint is here to do; you suddenly require a developer to make the updates rather than doing it yourself.

Another request, while understandable, is to keep the design implementation as cheap as possible (of course, this is after the design has been determined).  Oftentimes this can be done by using content editor web parts.  This seems like an obvious solution, and sounds simple on it’s surface to update (it allows the user to insert content of almost any type – links, images, text, photos, etc) and all the site builder/dev needs to do is stylize the part.  The problem again is in order to keep this part looking nice the end user must know HTML.  Also, they will have to always go into the web part to edit, and they will have to be very careful with the size of the content they are adding so as to not cause the site build, again, to ‘break’.  I would recommend one of two alternatives:

1. Use a design that compliments the OOB web parts (i.e. a lone video viewer web part, a seperate links web part, announcements web part, etc)  this can still be stylized, but it works with SharePoint rather than trying to invent your own combined part.

2. Use lists that pull in data to the parts.  While more expensive, this is much much easier to the end user and a much more sustainable, and clean solution.  This is a dream come true to the end user.  We have used this solution anywhere from pulling data into Featured News silverlight parts to modified Team Announcements on a home page.  What this means is:  the developer/site builder will implement styles on the pages so you can have your fancy design.  The site/page owner will go to the list as indicated by the dev.  They will simply select ‘add new item’ on their list.  Based on the design, they will then add whatever content is needed (photo, description, title, etc) and save.  The end user never actually touches the part! This process will populate the ‘fancy webpart’ on it’s own.  No worries on breaking the design, no knowledge of HTML and no formatting necessary.

Also note, what I have seen happen many times with trying to take the ‘cheaper route’ of content editor parts or even hard coding HTML on the page, is that this actually ends up being a more expensive solution, because they end up realizing that they can’t update and need to find a dev to make the udpates for them.  Alternatively, they ask to have the entire page re-done, the ‘right’ way.

Three of the biggest recommendations I hope you can take from this when brainstorming on design/budget for your SharePoint site:

  • Do NOT use rounded corners on your design
  • Avoid Content Editor web parts unless you know HTML
  • Cheaper initially does not always mean cheaper in the end

You can see all sorts of examples on our company site http://www.affirmaconsulting.com

I hope this proves helpful and best of luck on your site coming to life!

Design in Real Life – The Wall

As Affirma’s Visual Design Practice Lead, my area of blogging focus will be real-world design dilemmas, and talking through our process for solving them.  This week it’s going to be very real-world.  We’re talking about The Wall.

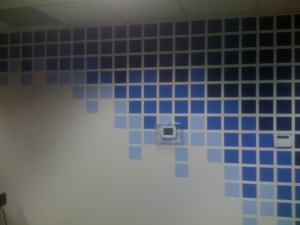
The Wall. Affirma has been working to customize and “spruce up” our office space, since it started out as what can be described as “1992 Cubicle Farm”.  Being the techy, sci-fi lovers that we are, we like grids, lines and squares. Ultimately a design student friend of the team came up with a very cool grid design utilizing three  shades of blue. Affirma’s logo has a dark navy blue color that was used as the inspiration for the darkest starting color. The two remaining colors are a medium and a lighter shade of the same blue.

Design side note here – using varying shades or even sheens of the same color can give a simple yet sophisticated design look. I’ve used this technique with painting floor to ceiling stripes or diamond shapes with great success. The same color will look darker with a high gloss versus flat or even an eggshell gloss. Give it a try, it’s only paint.

So that was a geat start to the newly updated wall – colors and a design we all agreed on. Most of the battle is behind us and all that’s left is implementation.  Sounds easy, straight lines and squares of the same size on a large scale.

It turns out that laying out and masking a couple hundred squares on a wall – and getting them straight, level, and symmetric – is more challenging than doing the same thing in PhotoShop.  Yeah, right?  But with two attempts, a good ruler, a 6 foot level and lots of determination we had straight lines and sound squares up and ready for paint. In the next few days we completed painting the wall and everyday I walk past it, I smile because as a team, we took the time to make it right. This pretty much sums up how we do everything at Affirma. If you see an issue and you can fix it, step up, offer your support and make it right.

Here’s a couple of  in-progress photos and the final result, much better in person of course.

In progress
pixel wall in progress – masking

final result

Generalized Properties in C#

We’re all familiar with properties in C#.  Objects can have properties, property values can be got and set, and you can run code when they are got or set.  Simple, powerful, used all the time.

But they have a weakness.  Unless you get into the messy business of reflection, the compiler has to know at compile-time how you’re going to use the properties.  What do I mean by that?  I mean that to use a property on an object, you need to have a reference to that object, you need to know the type of that object, and your code needs to know both the name and type of the property.  The compiler needs to be able to resolve the whole usage.

Okay, but what if you need to make decisions about how to get or set properties at run-time?  Imagine you have a component that needs to do work on properties from a lot of different sources.  Let’s say it only knows the type of the properties and knows it needs to set them, but shouldn’t know about the parent objects or the real name of the properties?

What do we need?  Generalized properties!

Okay, so let’s distill a property down to it’s most basic form.  It has a value.  You can get that value.  You can set that value.  For simplicity’s sake and for now, let’s say we don’t even need to know the type of the value.  We’d like it to be easily portable.  BAM, let’s make it an object:

/// <summary>
    /// A PropertyProxy is an object that behaves like a property.  It has a Value that you can get or set.
    /// It can be databound to, allowing databinding decisions to be made at run-time.
    /// </summary>
    public abstract class PropertyProxy
    {
        public object Value
        {
            get
            {
                return this.getValue();
            }
            set
            {
                this.setValue(value);
            }
        }

        protected abstract object getValue();
        protected abstract void setValue(object value);
    }

This is the abstract base class.  In actual usage, we’d subclass it and provide a specific implementation for getValue and setValue.  Now we can instantiate one of these and pass it around, and client code doesn’t need to know about what’s actually happening when you get or set the value.

Other advantages:

– Complex databinding decisions can be made at run-time.

– It can be used to protect our data objects from meddling.  They have control over how they are used.

– We can run arbitrary code in getValue and setValue.  They don’t actually HAVE TO hook up to the getters and setters of real C# properties.  Imagine hooking setValue up to an Undo/Redo system.

Next time I’ll talk about how the PropertyProxy can be extended, and the real reason why we built it.  Why would we need to generalize properties?  I’ll let you sit with that.

ASP.NET MVC: Maintaining URL Permanence with Legacy Routes

What makes a cool URI?
A cool URI is one which does not change.
What sorts of URI change?
URIs don’t change: people change them.

– Tim Berners-Lee, creator of the interwebs

While working on our current ASP.NET MVC 3 project, we came across a requirement to maintain a large directory of .htm files that were used as content generated by users of the website.  While blowing off the dust and looking inside of the files we realized that there we lots of URLs that are supposed to be active pages.  Some of these were locations of images that were moving, while others were old ASP pages that are still redirected and even still register is the top 10 of search results for their associated keywords.  Immediately one of our developer’s heads began pounding with the pain of regular expression string replacement.

But wait!  These are permanent URLs that still have active SEO functionality.  Our client needs these links to stay active and not 404 their way into irrelevance.  Plus, it would be a pain to either:

  1. Go through each HTM file and string replace as many combinations we can find, or
  2. Use string replace each and every time we try to load the file

Enter Routing made easy with ASP.NET MVC 3.

First, we had to make sure the linked images in these files still display images when loaded up in the browser.  Most are located at the address:

<img src="http://www.mydomain.com/images/feature/myimage.jpg" />

..or something similar.  However, with the new design these images no longer lived at this physical location.  Hmm . . . to the Routes!

routes.MapRoute(
                "FeatureImage",
                "images/feature/{filename}",
                new { controller = "Image", action = "Feature" }
            );

Okay, great you defined a route.  But how do you give an image as a “View”?  Well, thankfully in ASP.NET MVC there is a FilePathResult.

public ActionResult Feature(string filename)
        {
            return File("~/content/images/features/" + filename, "image/jpeg");
        }

public class ImageController : Controller
    {
        public ActionResult Feature(string filename)
        {
             return File("~/content/images/features/" + filename, "image/jpeg");
        }
    }

There is also the option to actually create a stream and return a FileStreamResult as well, but this lets us do the same without having to open/close a stream reader.

So now that we have the image URL out of the way, what about those legacy ASP/ASPX routes that will no longer be valid?  And how can we do it without losing SEO value that our client has built up over the years?  Hmm . . . to the Routes!

Imagine we have the legacy route “/feature/showFeature.asp?fid={id}”

routes.MapRoute(
                "LegacyRoute",
                "feature/showFeature.asp",
                new { controller = "Features", action = "BackwardsCompatibleDetail" }
            );

And so the legacy route is now generated and matched, but how to handle that query string parameter?  Well you can define those in the Routing, but they are passed on as Nullable parameter objects to your methods on your controllers.

public ViewResult BackwardsCompatibleDetail(int? fid)
        {
            return View("Detail", _repository.GetById(eid.GetValueOrDefault()));
        }

And there you go!  You’re legacy route is now generated in the new MVC route table!

So that’s great and all, but what I really want is for those URLs to no longer be generated and instead just issue 301 redirects to the new URL path for this resource.  Phil Haack (Best. Name. Ever.) comes to the rescue with his RouteMagic library, available I might add via NuGet.  His example:

var route = routes.MapRoute("new", "bar/{controller}/{id}/{action}");
routes.Redirect(r => r.MapRoute("old", "foo/{controller}/{action}/{id}"))
  .To(route);

And the best part is a lot of this Routing framework is extendible, so we can create our own handlers and such to do even more complex things with the Routing.  But out of the bag, there are plenty of options with dealing with your SEO URL permanence and making sure those continue to bring in the traffic you need.  Viva Routing + MVC!

Enabling MSChart ImageMap and AJAX functionality

    In a previous post I talked about utilizing MSChart in an SSRS report. In this post we will talk about how to use the image map capabilities of the MSChart control. You will need to create two identical charts, one set with a render type of imagemap, the other set to binarystreaming. The easiest way to do this without having duplicate code is to create a user control containing your chart.

<%@ Control Language="C#" AutoEventWireup="true" CodeFile="graph.ascx.cs" Inherits="graph" %>
<%@ Register Assembly="System.Web.DataVisualization, Version=3.5.0.0, Culture=neutral, PublicKeyToken=31bf3856ad364e35" Namespace="System.Web.UI.DataVisualization.Charting" TagPrefix="asp" %> 
<asp:chart id="mainChart" runat="server" height="296px" width="412px"
    imagetype="Png" palette="BrightPastel" backcolor="LightBlue" rendertype="BinaryStreaming"
    borderdashstyle="Solid" backgradientstyle="TopBottom" borderwidth="2" bordercolor="181, 64, 1">
    <titles>
        <asp:Title ShadowColor="32, 0, 0, 0" Font="Trebuchet MS, 14.25pt, style=Bold" ShadowOffset="3" Text="Binary Streaming" ForeColor="26, 59, 105"></asp:Title>
    </titles>
    <legends>
        <asp:Legend Enabled="True" IsTextAutoFit="True" Name="Default" BackColor="Transparent" Font="Trebuchet MS, 8.25pt, style=Bold" Alignment="Center" Docking="Bottom"></asp:Legend>
    </legends>
    <borderskin skinstyle="Emboss" />
    <series>
        <asp:Series XValueType="String" Name="Targets" ChartType="SplineArea" BorderColor="180, 26, 59, 105" Color="220, 0, 0, 0" YValueType="Double"/>
        <asp:Series XValueType="String" Name="Actuals" ChartType="SplineArea" BorderColor="180, 26, 59, 105" Color="127, 255, 255, 0" YValueType="Double"/>
        <asp:Series XValueType="String" Name="ActualPoints" ChartType="SplineArea" BorderColor="180, 200, 59, 105" Color="127, 65, 140, 240" YValueType="Double"/>
    </series>
    <chartareas>
        <asp:ChartArea Name="MainChartArea" BorderColor="64, 64, 64, 64" BorderDashStyle="Solid" BackSecondaryColor="White" BackColor="OldLace" ShadowColor="Transparent">
            <axisy linecolor="64, 64, 64, 64">
                <labelstyle font="Trebuchet MS, 8.25pt, style=Bold"/>
                <majorgrid linecolor="64, 64, 64, 64"/>
            </axisy>
            
            <axisx IsMarginVisible="False" linecolor="64, 64, 64, 64">
                <labelstyle font="Trebuchet MS, 8.25pt, style=Bold"/>
                <majorgrid linecolor="64, 64, 64, 64"/>
            </axisx>
        </asp:ChartArea>
    </chartareas>
</asp:chart>

In the code behind of your graph user control you will want to publicly expose the chart control.

 public System.Web.UI.DataVisualization.Charting.Chart MainChart
    {
        get
        {
            return mainChart;
        }
    }

The Page Load event should go about parsing the query string for any data needed to generate the chart itself.

protected void Page_Load(object sender, EventArgs e)
    {
        if (!IsPostBack)
        {
            int kpiID = 0;
            int organizationID = 0;
            int programID = 0;
            int fiscalYearID = 0;
            int height = 0;
            int width = 0;

            int.TryParse(Request.QueryString["kpiID"], out kpiID);
            int.TryParse(Request.QueryString["organizationID"], out organizationID);
            int.TryParse(Request.QueryString["programID"], out programID);
            int.TryParse(Request.QueryString["fiscalYearID"], out fiscalYearID);
            int.TryParse(Request.QueryString["height"], out height);
            int.TryParse(Request.QueryString["width"], out width);

            if (height == 0)
                height = 296;

            if (width == 0)
                width = 412;

            mainChart.Height = Unit.Pixel(height);
            mainChart.Width = Unit.Pixel(width);


            string kpiName = Request.QueryString["kpiName"];

            if (kpiID != 0)
                BuildGraph(kpiID, fiscalYearID, organizationID, programID, kpiName);
        }
    }

    The next step is to create two web pages: graph.aspx, and graphImageMap.aspx.  Each page will contain nothing but your newly created graph user control, however, their code behinds will differ slightly.

GraphImage.aspx content:

Page Content for graphImage.aspx:

<%@ Page Language="C#" AutoEventWireup="true" CodeFile="graphImage.aspx.cs" Inherits="graphImage" %>
<%@ Register src="ascx/graph.ascx" tagname="graph" tagprefix="uc1" %>
<uc1:graph ID="graph1" runat="server" />

Code Behind for graphImage.aspx:

public partial class graphImage : System.Web.UI.Page
{
    protected void Page_Load(object sender, EventArgs e)
    {
        if (!IsPostBack)
        {
            graph1.MainChart.RenderType = System.Web.UI.DataVisualization.Charting.RenderType.BinaryStreaming;
        }
    }
}

GraphImageMap.aspx content:

Page Content for graphImageMap.aspx:

<%@ Page Language="C#" AutoEventWireup="true" CodeFile="graphImageMap.aspx.cs" Inherits="graphImageMap" %>
<%@ Register src="ascx/graph.ascx" tagname="graph" tagprefix="uc1" %>
<uc1:graph ID="graph1" runat="server" />

Code Behind for graphImageMap.aspx:

public partial class graphImageMap : System.Web.UI.Page
{
    protected void Page_Load(object sender, EventArgs e)
    {
        if (!IsPostBack)
        {
            graph1.MainChart.RenderType = System.Web.UI.DataVisualization.Charting.RenderType.ImageMap;
            graph1.MainChart.ImageLocation = "graphImage.aspx?" + Request.QueryString.ToString();
        }
    }
}


In the code behind of the graphImage web page, set the exposed chart control property of the graph user control to binary streaming. In the code behind of the graphImageMap web page, set the exposed chart control property of the graph user control to imagemap. Also, set the ImageLocation property to reference graphImage webpage and pass along the query string. This will ensure that the imagemap page is creating the exact same chart as the image page chart. To try out this new MS Chart functionality, we used JQUERY to setup a real world example. Let’s say you want to pop up an interactive chart when a user hovers over a link on a webpage.

<html>
<head>
 <script type="text/javascript" src="js/jquery-1.4.4.min.js"></script>
    <script type="text/javascript" src="js/jquery-ui-1.8.6.custom.min.js"></script>
    
     <script type="text/javascript">
         function ShowDialog(imgURL) {
             var uniqueTime = new Date().getTime();
             $("#graphImage").attr("src", imgURL + '&time=' + uniqueTime);
             $("#dialog").dialog("open");
         }
         // we will add our javascript code here
         $(document).ready(function() {
             $("#dialog").dialog({
                 autoOpen: false,
                 height: 350,
                 width: 440,
                 modal: false,
                 closeOnEscape: true,
                 show: 'fade',
                 hide: 'fade'
             });


         });

     function ShowDialog(imgURL) {
             $("#graphImage").attr("src", imgURL);
             $("#dialog").dialog("open");
         }
         // we will add our javascript code here
         $(document).ready(function() {

             $(".test").mouseenter(function() {
                 $.ajax({
                     url: "graphImageMap.aspx?kpiID=2004&fiscalYearID=5&organizationID=4&programID=219&kpiname=AmazingMetric",
                     cache: false,
                     async: false,
                     success: function(html) {
                         $("#dialogInner").replaceWith(html);
                     }
                 });
                 $("#dialog").dialog("open");
             });
     </script>  
</head>
<body>
    <a id='link' class="test">hello world</a>
        <div id="dialog" title="My Graph">
            <div id="dialogInner"></div>
        </div>
</body>
</html>

I hope you found this post helpful in creating an interactive MS Charting solution.  Now get coding!

Utilizing MSChart in SSRS

    MSChart has been around for a while now, but we found a new use for it regarding some SSRS (SQL Server Reporting Services) reports we were creating the other day.

    We had a need to generate some charts on the fly based on a particular action taken by a user, like clicking a metric. The MS Chart controls have some really nice capabilities for a free charting package. They support caching, multiple data binding scenarios, and AJAX driven events, just to name a few. We utilized the charts ability to generate a binary stream of data to create our own custom image handler.  In order to try this out yourself, simply create a web page with nothing in it but a chart control like the below example.

<%@ Control Language="C#" AutoEventWireup="true" CodeFile="graph.ascx.cs" Inherits="graph" %>
<%@ Register Assembly="System.Web.DataVisualization, Version=3.5.0.0, Culture=neutral, PublicKeyToken=31bf3856ad364e35" Namespace="System.Web.UI.DataVisualization.Charting" TagPrefix="asp" %> 
<asp:chart id="mainChart" runat="server" height="296px" width="412px"
    imagetype="Png" palette="BrightPastel" backcolor="LightBlue" rendertype="BinaryStreaming"
    borderdashstyle="Solid" backgradientstyle="TopBottom" borderwidth="2" bordercolor="181, 64, 1">
    <titles>
        <asp:Title ShadowColor="32, 0, 0, 0" Font="Trebuchet MS, 14.25pt, style=Bold" ShadowOffset="3" Text="Binary Streaming" ForeColor="26, 59, 105"></asp:Title>
    </titles>
    <legends>
        <asp:Legend Enabled="True" IsTextAutoFit="True" Name="Default" BackColor="Transparent" Font="Trebuchet MS, 8.25pt, style=Bold" Alignment="Center" Docking="Bottom"></asp:Legend>
    </legends>
    <borderskin skinstyle="Emboss" />
    <series>
        <asp:Series XValueType="String" Name="Targets" ChartType="SplineArea" BorderColor="180, 26, 59, 105" Color="220, 0, 0, 0" YValueType="Double"/>
        <asp:Series XValueType="String" Name="Actuals" ChartType="SplineArea" BorderColor="180, 26, 59, 105" Color="127, 255, 255, 0" YValueType="Double"/>
        <asp:Series XValueType="String" Name="ActualPoints" ChartType="SplineArea" BorderColor="180, 200, 59, 105" Color="127, 65, 140, 240" YValueType="Double"/>
    </series>
    <chartareas>
        <asp:ChartArea Name="MainChartArea" BorderColor="64, 64, 64, 64" BorderDashStyle="Solid" BackSecondaryColor="White" BackColor="OldLace" ShadowColor="Transparent">
            <axisy linecolor="64, 64, 64, 64">
                <labelstyle font="Trebuchet MS, 8.25pt, style=Bold"/>
                <majorgrid linecolor="64, 64, 64, 64"/>
            </axisy>
            
            <axisx IsMarginVisible="False" linecolor="64, 64, 64, 64">
                <labelstyle font="Trebuchet MS, 8.25pt, style=Bold"/>
                <majorgrid linecolor="64, 64, 64, 64"/>
            </axisx>
        </asp:ChartArea>
    </chartareas>
</asp:chart>

    This allows us to create an external image in our SSRS report with a source expression something like = "http://mysite/graph.aspx?metricID=&quot; & Fields!MetricID.Value & "&fiscalYearID=" & Fields!FiscalYearID.Value from a bound dataset within the report. One gotcha we encountered was the need to setup an unattended execution account on the Reporting Server so that external images could be served up. Learn how to configure the unattended execution account here: Configuring the unattended execution account.  While this is a very flexible way to generate custom images on the fly for reports, we decided we wanted a little more interactivity.

    MSChart supports image maps as well as AJAX callbacks allowing the client to interact with the chart images. We utilized this ability to create custom tooltips for commentary at certain datapoints.  This can be accomplished by iterating through the individual datapoints of your series and setting the MapAreaAttributes property.

mainChart.Series["ActualPoints"].Points[count].MapAreaAttributes = "onmouseover=\"DisplayTooltip('" + toolTip + "');\" onmouseout=\"DisplayTooltip('');\"";

    If you intend to use the image map or AJAX callback support, you will be unable to use the image handler approach since the chart will need to generate an image map and possibly an update panel to perform AJAX events. We will address using the image map and AJAX callback functionality in a future post.

Silverlight Pivot Viewer – Automatic Pivot Collection Generation via Customized Pauthor tool

    The Microsoft Silverlight Pivot Viewer is a new innovative way to look at a massive amount of data in a fast visually comparative way. PivotViewer utilizes Microsoft’s Deep Zoom technology which enables it to take advantage of high resolution imagery without taking a hit on performance.

    Lately, we have been utilizing PivotViewer for Business Intelligence applications. If you are using PivotViewer to simply navigate and categorize images, the images themselves aren’t very important. However, if you are intending to utilize PivotViewer for a BI application, you will want to communicate the business information visually, that is the point after all, isn’t it? There are several ways to generate PivotViewer collections. The pivot collection creator for excel (here) provides a fast, simple way to generate PivotViewer collections. The main drawback of the excel tool is that the images for each item must already exist, plus this is still a very manual process. This is where the Pauthor tool comes into play.

    The Pauthor tool is an open source command line tool for generating pivot collections from various formats, such as excel, csv, and cxml formats. Pauthor allows for the generation of pivot images from an html template, as well as the creation of new data sources and target sources that implement an OLE DB driver. We created a SQL Server datasource based on the OleDBCollectionSource.  This allowed us to use tables, or views, or even stored procedures to generate the pivot collection facet categories, items, and collection text.

public class SqlCollectionSource : OleDbCollectionSource
    {
        /// <summary>
        /// Creates a new Excel collection source and sets its <see cref="BasePath"/>.
        /// </summary>
        /// <param name="basePath">the path to the Excel file containing the collection's data</param>
        public SqlCollectionSource(String serverName, String dbName, String collectionTableName, String facetTableName, String itemTableName)
            : base(String.Format(ConnectionStringTemplate, serverName, dbName), ".")
        {
            m_serverName = serverName.ToLowerInvariant();
            m_dbName = dbName.ToLowerInvariant();
            m_collectionTableName = collectionTableName.ToLowerInvariant();
            m_facetTableName = facetTableName.ToLowerInvariant();
            m_itemTableName = itemTableName.ToLowerInvariant();
        }

        protected override void LoadHeaderData()
        {
            this.ConnectionString = String.Format(ConnectionStringTemplate, m_serverName, m_dbName);
            this.UpdateDataQueries();

            base.LoadHeaderData();
        }

        private void UpdateDataQueries()
        {
            //String connectionString = String.Format(ConnectionStringTemplate, this.BasePath);
            using (OleDbConnection connection = new OleDbConnection(this.ConnectionString))
            {
                connection.Open();
                DataTable schema = connection.GetOleDbSchemaTable(
                    OleDbSchemaGuid.Tables, new Object[] { null, null, null, "TABLE" });
                
                String firstTableName = null;
                foreach (DataRow row in schema.Rows)
                {
                    String table = row["Table_Name"].ToString();
                    String lowerTable = table.ToLowerInvariant();
                    if (lowerTable == m_collectionTableName)
                    {
                        this.CollectionDataQuery = String.Format(CommandTemplate, table);
                    }
                    if (lowerTable == m_facetTableName)
                    {
                        this.FacetCategoriesDataQuery = String.Format(SortedCommandTemplate, table);
                    }
                    if (lowerTable == m_itemTableName)
                    {
                        this.ItemsDataQuery = String.Format(SprocTemplate, table);
                    }
                    if (firstTableName == null) firstTableName = table;
                }

                schema = connection.GetOleDbSchemaTable(
                    OleDbSchemaGuid.Procedures, new Object[] { null, null, m_itemTableName, null });

                
                foreach (DataRow row in schema.Rows)
                {
                    String table = row["Procedure_Name"].ToString();
                    table = table.Remove(table.IndexOf(';'));
                    String lowerTable = table.ToLowerInvariant();
                    
                    if (lowerTable == m_itemTableName)
                    {
                        this.ItemsDataQuery = String.Format(SprocTemplate, table);
                    }
                
                }

                if (this.ItemsDataQuery == null)
                {
                    this.ItemsDataQuery = String.Format(CommandTemplate, firstTableName);
                }
            }
        }

        private const String ConnectionStringTemplate = "Provider=SQLNCLI10; Server={0};" +
            "Database={1}; Trusted_Connection=yes;";

        private const String CommandTemplate = "SELECT * FROM [{0}]";
        private const String SortedCommandTemplate = "SELECT * FROM [{0}] order by sort";
        private const String SprocTemplate = "exec [{0}]";
        private String m_serverName = string.Empty;
        private String m_dbName = string.Empty;
        private String m_collectionTableName = string.Empty;
        private String m_facetTableName = string.Empty;
        private string m_itemTableName = string.Empty;
    }

Customizing the HTML template functionality

    The base HTML template functionality allows you to specify an html file incorporating meta tags like {name} {href} and any other custom pivot facet categories your items use within the html itself. Pauthor then iterates through the collection item datasource and creates a new html file for each one by replacing all of these tags with the item data source values. A web browser control is then run within the code to load up the newly generated html file and save an image out to the file system. Deep zoom images are then created for the pivot collection based off of this saved custom image as well as the xml of the pivot collection itself. We also customized the html template functionality allowing for a template query string to be used.

Example: /html-url http://www.example.com/PivotCard?itemPrimaryKey={itemPrimaryKey}

    This immediately increases the flexibility of the images we create, as we can now generate any html we want using standard web technology based on the values we receive off of the query string as opposed to scattering meta tags in an html file. Managing a web page which generates these Pivot Images is much easier to maintain than trying to generate images manually using a graphics library. You can imagine the time involved in changing an image template, moving lines around, drawing text with wrapping capabilities, etc, each time your Pivot Card format changes.

Pivot Collection Generation

    Pivot collection generation is now a breeze! There are no longer any manual steps with having our data in a database and images automatically generated and saved on the web server which serves up the pivot collection.  Collection generation can now be kicked off with a nightly scheduled task or even more frequently if needed. We are currently working on creating a means of generating pivot cards on a one off basis so that the collection can be maintained in near real time without incurring the cost of generating the entire collection each time an item changes. Stay tuned!

Pixel Shaders w/ Source (And a demo!)

In an earlier post, I showed some still images of Silverlight pixel shaders and how we used the awesome tool Shazzam in our development.  Today I’d like to post the code and show some interesting uses of the shaders.  (Live!)

Let’s start with the code for the Telescopic Blur effect.  Here’s the relevant HLSL:

/// &lt;summary&gt;Center X of the Zoom.&lt;/summary&gt;
/// &lt;minValue&gt;0&lt;/minValue&gt;
/// &lt;maxValue&gt;1&lt;/maxValue&gt;
/// &lt;defaultValue&gt;0.5&lt;/defaultValue&gt;
float CenterX : register(C0);

/// &lt;summary&gt;Center Y of the Zoom.&lt;/summary&gt;
/// &lt;minValue&gt;0&lt;/minValue&gt;
/// &lt;maxValue&gt;1&lt;/maxValue&gt;
/// &lt;defaultValue&gt;0.5&lt;/defaultValue&gt;
float CenterY : register(C1);

/// &lt;summary&gt;Amount of zoom blur.&lt;/summary&gt;
/// &lt;minValue&gt;0&lt;/minValue&gt;
/// &lt;maxValue&gt;3&lt;/maxValue&gt;
/// &lt;defaultValue&gt;2.5&lt;/defaultValue&gt;
float BlurAmount : register(C2);

sampler2D input : register(s0);

float4 main(float2 uv : TEXCOORD) : COLOR

{
    float4 c = 0;
    uv.x -= CenterX;
    uv.y -= CenterY;

    float distanceFactor = pow(pow(uv.x,2) + pow(uv.y, 2),2);

    for(int i=0; i < 15; i++)
    {
        float scale = 1.0 - distanceFactor * BlurAmount * (i / 30.0);
        float2 coord = uv * scale;
        coord.x += CenterX;
        coord.y += CenterY;
        c += tex2D(input,coord);
    }

    c /= 15;
    return c;
}

It takes 3 inputs.  By altering the center of the zoom, you can do some fun stretching motions.  As you’ll see in the demo below, it turned out to be a neat way to make text fly into view.  You can also alter the amount of zoom blur.  I’ll leave it up to the reader to play with this within Shazzam.

Next we have the underwater effect:

sampler2D input : register(s0);

float Timer : register(C0);

static const float2 poisson[12] =
{
        float2(-0.326212f, -0.40581f),
        float2(-0.840144f, -0.07358f),
        float2(-0.695914f, 0.457137f),
        float2(-0.203345f, 0.620716f),
        float2(0.96234f, -0.194983f),
        float2(0.473434f, -0.480026f),
        float2(0.519456f, 0.767022f),
        float2(0.185461f, -0.893124f),
        float2(0.507431f, 0.064425f),
        float2(0.89642f, 0.412458f),
        float2(-0.32194f, -0.932615f),
        float2(-0.791559f, -0.59771f)
};

float4 main(float2 uv : TEXCOORD) : COLOR
{
	float2 Delta = { sin(Timer + uv.x*23 + uv.y*uv.y*17)*0.02 , cos(Timer + uv.y*32 + uv.x*uv.x*13)*0.02 };

    float2 NewUV = uv + Delta;

	float4 Color = 0;
	for (int i = 0; i < 12; i++)
	{
	   float2 Coord = NewUV + (poisson[i] / 50);
       Color += tex2D(input, Coord)/12.0;
     }
     Color += tex2D(input, uv)/4;
     Color.a = 1.0;
     return Color;
}

Its input is a timer value, so that it can be animated.  If you compile this into a Silverlight effect, you can make the timer be a DependencyProperty, which allows the effect to be animated by Storyboard.  I love XAML.

While this is a “passable” underwater effect (and I’m still working on a better one), I found an unanticipated use for it.  But first, a digression.

A year or two ago, LucasArts re-released their classic game The Secret of Monkey Island for the XBox.  I played this game extensively as a teenager, so of course I downloaded the new version and played through again, to see what they had done with the new capabilities of modern hardware.  I wasn’t disappointed.  While upgrading the look, they had stayed faithful to the design spirit of the original.  And one of the most impressive effects was the Ghost Pirate LeChuck.  He had a wavy, wispy quality.  (As shown here.)  It was fluid and animated and very impressive, and at the time I didn’t know how they did it.

Fast forward a year or two and we’re working on the underwater shader.  On a whim, I applied it to a white square in front of a black background.  Whoah.  Now I knew.  So we put together a quick ghost demo using the underwater effect and you can see it, along with the telescopic effect used as a transition, by clicking here.

Click for Pixel Shaders Demo

Click for Pixel Shaders Demo